
Intuitive - BI dashboards
Data insight with clever dashboards
Simplify your PaperCut, MPS or Print Management solution’s reports to get real-time information on print costs, risks or environmental impact
Add Intuitive’s dashboards for PaperCut
Intuitive solves a problem that your clients have, offering a simple way to view reporting data from their PaperCut accounts to help manage the way the organisation prints. It’s a super-easy to implement and a great value-add for your customers.
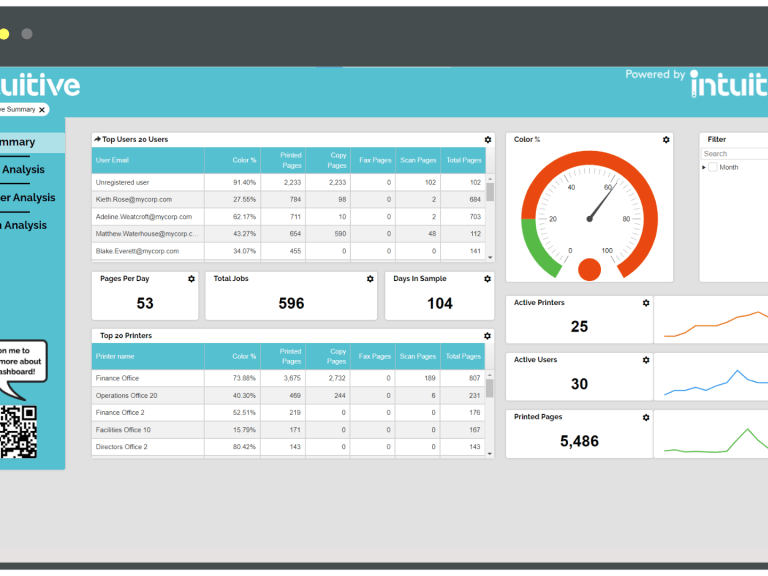
How will customers benefit from Intuitive dashboards?
Dashboards allow managers to monitor different metrics within their organisation, to gauge exactly how an organisation is using their printers. Intuitive’s dashboards allow you to capture and report print data such as costs, department resources and environmental impact, giving valuable feedback on the organisations print usage, which helps to see where savings and performance can be improved.
Manage costs
- See where print demand is coming from (user, print groups, application, device and the relationships between them)
- View the latest available usage data for your multi-function devices, giving you shorter & more effective decision cycles
- Automate and personalise monthly reporting for different budget holders
- Identify opportunities to improve the efficiency of your print management infrastructure
- Monitor the effectiveness of your print management policies and rules
Environmental impact
Intuitive dashboards for Papercut provide you with data relating to your MFD usage, and their effects on the environment.
Dashboards show you:
- CO2 produced
- Paper and electricity consumption
- Environmental impact to print users
This helps bring awareness to the workforce by showing the impact of their printing habits, as well as reinforcing positive printing habits via improvements on dashboards as their efforts take effect.
Easy to use
Intuitive dashboards can be customised to suit your needs, including:
- Pre-configured, popular reports
- Fully-customisable dashboards
- Seeing the data you want to see in real-time
- Sharing data with different departments
- Securing private data, and making it available to specific users
Quick & personalised data
See the data you want, in a way that you want to see it. Intuitive dashboards for Papercut allow you to view data from the entire organisation or filtered to show data of interest:
- View different departments
- See one or more print groups
- Organise by groups of printers
What is Business Intelligence (BI)?
BI is a coverall term for collecting, storing and analysing the data of business operations that are used to optimise performance. It is valuable because it helps people to make better business decisions.
Put in the context of Managed Print; it helps businesses to identify areas of improvement with regards to print output and enables changes to be made, as well as identifying users or departments who are guilty of being overzealous with the print button!
Get more out of your data using Intuitive
Intuitive for PaperCut – colour printing
Intuitive for PaperCut – recent leaver’s print jobs
Intuitive for PaperCut – identifying print hotspots
Demo Intuitive
See Intuitive in action and try it yourself!